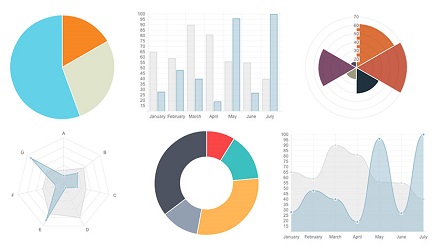
Một số dạng biểu đồ cơ bản với thư viện Chart.js và Html
Chia sẻ
Thật dễ dàng để tạo ra một số biểu đồ đơn giản cho web với thư viện Chart.js và Html
1. HTML
<!-- <script src="https://www.chartjs.org/dist/2.9.3/Chart.min.js"></script> -->
<!-- <script src="https://www.chartjs.org/samples/latest/utils.js"></script> -->
<!-- <link rel="stylesheet" href="https://maxcdn.bootstrapcdn.com/bootstrap/4.0.0/css/bootstrap.min.css" integrity="sha384-Gn5384xqQ1aoWXA+058RXPxPg6fy4IWvTNh0E263XmFcJlSAwiGgFAW/dAiS6JXm" crossorigin="anonymous"> -->
 <div class="row" id="body">
            <div class="col">
                <div style="width:50%;">
                    <canvas id="bar-chart" width="600" height="450"></canvas>
                </div>
            </div>
            <div class="col">
                <div style="width:50%;">
                    <canvas id="line-chart" width="600" height="450"></canvas>
                </div>
            </div>
            <div class="w-100"></div>
            <div class="col">
                <div style="width:50%;">
                    <canvas id="pie-chart" width="600" height="450"></canvas>
                </div>
            </div>
            <div class="col">
                <div style="width:50%;">
                    <canvas id="radar-chart" width="600" height="600"></canvas>
                </div>
            </div>
            <div class="w-100"></div>
            <div class="col">
                <div style="width:50%;">
                    <canvas id="doughnut-chart" width="600" height="450"></canvas>
                </div>
            </div>
            <div class="col">
                <div style="width:50%;">
                    <canvas id="bar-chart-grouped" width="600" height="450"></canvas>
                </div>
            </div>
        </div>
2. CSS
 canvas {
            -moz-user-select: none;
            -webkit-user-select: none;
            -ms-user-select: none;
            }
  #body{
            margin-right: -300px;
            margin-left: 20px;
            }
3. JAVASCRIPT
 //bar-chart
            	new Chart(document.getElementById("bar-chart"), {
               type: 'bar',
               data: {
                 labels: ["Africa", "Asia", "Europe", "Latin America", "North America"],
                 datasets: [
                   {
                     label: "Population (millions)",
                     backgroundColor: ["#3e95cd", "#8e5ea2","#3cba9f","#e8c3b9","#c45850"],
                     data: [2478,5267,734,784,433]
                   }
                 ]
               },
               options: {
                 legend: { display: false },
                 title: {
                   display: true,
                   text: 'Predicted world population (millions) in 2050'
                 }
               }
            });
            //End bar-chart
            //Line-chart
            new Chart(document.getElementById("line-chart"), {
             type: 'line',
             data: {
               labels: [1500,1600,1700,1750,1800,1850,1900,1950,1999,2050],
               datasets: [{
                   data: [86,114,106,106,107,111,133,221,783,2478],
                   label: "Africa",
                   borderColor: "#3e95cd",
                   fill: false
                 }, {
                   data: [282,350,411,502,635,809,947,1402,3700,5267],
                   label: "Asia",
                   borderColor: "#8e5ea2",
                   fill: false
                 }, {
                   data: [168,170,178,190,203,276,408,547,675,734],
                   label: "Europe",
                   borderColor: "#3cba9f",
                   fill: false
                 }, {
                   data: [40,20,10,16,24,38,74,167,508,784],
                   label: "Latin America",
                   borderColor: "#e8c3b9",
                   fill: false
                 }, {
                   data: [6,3,2,2,7,26,82,172,312,433],
                   label: "North America",
                   borderColor: "#c45850",
                   fill: false
                 }
               ]
             },
             options: {
               title: {
                 display: true,
                 text: 'World population per region (in millions)'
               }
             }
            });
            //End line-chart
            //Pie-chart
            new Chart(document.getElementById("pie-chart"), {
               type: 'pie',
               data: {
                 labels: ["Africa", "Asia", "Europe", "Latin America", "North America"],
                 datasets: [{
                   label: "Population (millions)",
                   backgroundColor: ["#3e95cd", "#8e5ea2","#3cba9f","#e8c3b9","#c45850"],
                   data: [2478,5267,734,784,433]
                 }]
               },
               options: {
                 title: {
                   display: true,
                   text: 'Predicted world population (millions) in 2050'
                 }
               }
            });
            //End Pie-chart
            //Radar-chart
            new Chart(document.getElementById("radar-chart"), {
               type: 'radar',
               data: {
                 labels: ["Africa", "Asia", "Europe", "Latin America", "North America"],
                 datasets: [
                   {
                     label: "1950",
                     fill: true,
                     backgroundColor: "rgba(179,181,198,0.2)",
                     borderColor: "rgba(179,181,198,1)",
                     pointBorderColor: "#fff",
                     pointBackgroundColor: "rgba(179,181,198,1)",
                     data: [8.77,55.61,21.69,6.62,6.82]
                   }, {
                     label: "2050",
                     fill: true,
                     backgroundColor: "rgba(255,99,132,0.2)",
                     borderColor: "rgba(255,99,132,1)",
                     pointBorderColor: "#fff",
                     pointBackgroundColor: "rgba(255,99,132,1)",
                     pointBorderColor: "#fff",
                     data: [25.48,54.16,7.61,8.06,4.45]
                   }
                 ]
               },
               options: {
                 title: {
                   display: true,
                   text: 'Distribution in % of world population'
                 }
               }
            });
            //End Radar-chart
            //Doughnut-chart
            new Chart(document.getElementById("doughnut-chart"), {
               type: 'doughnut',
               data: {
                 labels: ["Africa", "Asia", "Europe", "Latin America", "North America"],
                 datasets: [
                   {
                     label: "Population (millions)",
                     backgroundColor: ["#3e95cd", "#8e5ea2","#3cba9f","#e8c3b9","#c45850"],
                     data: [2478,5267,734,784,433]
                   }
                 ]
               },
               options: {
                 title: {
                   display: true,
                   text: 'Predicted world population (millions) in 2050'
                 }
               }
            });
            //End doughnut-chart
            //Bar-chart-grouped-chart
            new Chart(document.getElementById("bar-chart-grouped"), {
               type: 'bar',
               data: {
                 labels: ["1900", "1950", "1999", "2050"],
                 datasets: [
                   {
                     label: "Africa",
                     backgroundColor: "#3e95cd",
                     data: [133,221,783,2478]
                   }, {
                     label: "Europe",
                     backgroundColor: "#8e5ea2",
                     data: [408,547,675,734]
                   }
                 ]
               },
               options: {
                 title: {
                   display: true,
                   text: 'Population growth (millions)'
                 }
               }
            });
            //End bar-chart-grouped-chart
Mong bài viết giúp ích được các bạn phần nào trong thiết kế Web. Hãy nhấn nút Chia sẻđể mọi người cùng học hỏi kiến thức mới nhé. Cảm ơn các bạn đã quan tâm Forum.


